
Learning Objective
Measure temperature and humidity using a digital sensor.
Atmospheric Sensing (DHT11)
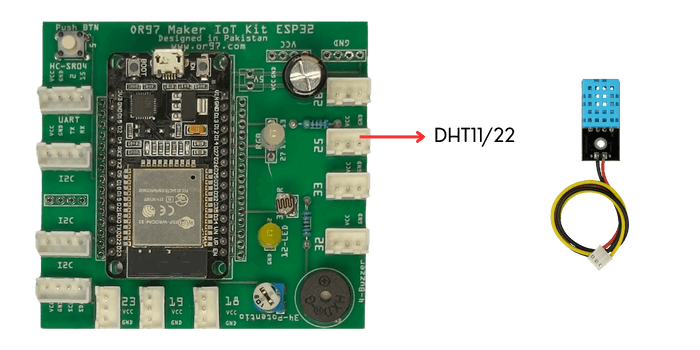
Hardware: MakerBuddy DHT11 Temp & Humidity Sensor
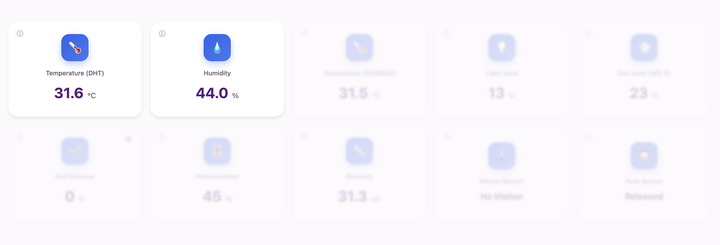
Dashboard: DHT11 Sensor Cards
Theory: Temperature and Humidity
Building on Your Sensor Knowledge
So far, we've explored simple sensors: buttons (digital on/off), potentiometers (analog position) and LDRs (light levels). Now we're stepping up to environmental sensors that measure invisible atmospheric conditions. The DHT11 is our first multi-function sensor, measuring both temperature and humidity simultaneously!
How the DHT11 Works
Inside the DHT11's blue grid housing are two key components: a thermistor(temperature-sensitive resistor) and a capacitive humidity sensor. The thermistor's resistance changes with temperature, allowing precise temperature measurement. The humidity sensor uses a moisture-absorbing polymer that changes its electrical capacitance based on water vapor in the air. A tiny microchip inside converts these analog measurements into a digital signal that the ESP32 can read.
DHT11 vs. DHT22: The Specs
While your Kit comes with the DHT11, you might also hear about its "big brother," theDHT22 (AM2302). The DHT22 is slightly more expensive but offers better range and accuracy. Here is how they compare:
| Feature | DHT11 | DHT22 |
|---|---|---|
| Temperature Range | 0°C to 50°C | -40°C to 80°C |
| Temperature Accuracy | ±2°C | ±0.5°C |
| Humidity Range | 20% to 80% | 0% to 100% |
| Humidity Accuracy | ±5% | ±2% to 5% |
| Sampling Rate | 1 Hz (1 reading / sec) | 0.5 Hz (1 reading / 2 sec) |
Understanding Humidity: The Water in Air
Humidity measures the amount of water vapor (invisible water gas) present in the air. We express it as relative humidity (RH%), which shows how much moisture is in the air compared to the maximum it could hold at that temperature. At 100% humidity, the air is saturated and can't hold more water - that's when dew forms or rain falls. Your breath contains lots of water vapor (which is why mirrors fog when you breathe on them), making it perfect for testing humidity sensors!
Real-World Applications
DHT11 sensors power smart thermostats that optimize home heating and cooling, weather stations that predict rain, greenhouse controllers that maintain perfect growing conditions, server rooms that prevent overheating and humidifiers that maintain comfortable indoor air quality. Museums use temperature and humidity monitoring to preserve priceless artifacts. Even your smartphone likely has similar sensors to prevent battery damage from extreme conditions!
For Teachers
This lesson introduces complex environmental sensing and multi-value sensors. Emphasize the invisible nature of humidity - students can't see it, but they can measure and feel it (sticky/muggy vs dry/comfortable). Connect to science: explain evaporation, condensation and the water cycle. The DHT11 uses digital communication protocol (not simple analog voltage), introducing students to more sophisticated sensor technology. Have students compare DHT11 readings with classroom thermometers and discuss accuracy. Create data logs showing daily temperature and humidity patterns.
For Parents
Your child is learning about environmental monitoring - a crucial skill for understanding climate, weather and indoor air quality. This week introduces the DHT11 sensor, which measures both temperature and humidity. These concepts connect to everyday experiences: why summer feels hotter when it's humid, why basements feel damp or why winter indoor air feels dry. Understanding these measurements helps students appreciate how smart homes maintain comfort automatically. This sensor will become essential in upcoming automation projects!
Hands-On Activity: DHT11 Setup
Activity Duration: 20-25 minutes
Students will connect the DHT11 sensor, observe real-time environmental readings and conduct experiments to understand how temperature and humidity change with different conditions.
Step-by-Step Instructions:
- Identify the DHT11: Find the DHT11 sensor - it has a blue plastic grid housing protecting the sensor elements.
- Locate the Connector: Find the connector labelled 25 on your MakerBuddy IoT Board.
- Connect the Sensor: Connect the DHT11 to its matching labelled MakerBuddy IoT Board connector. Ensure the keyed connector is correctly aligned to prevent reverse installation.
- Open the Dashboard: Navigate to your MakerBuddy web interface and locate the DHT11 sensor card showing Temperature (°C) and Humidity (%).
- Record Baseline Values: Without touching the sensor, note the current room temperature and humidity. These are your baseline "normal" values.
- Wait for Stabilization: DHT11 takes about 2-3 seconds between readings. Watch the values update - they should be relatively stable indoors.
- Create a Data Table: Record readings every minute for 5 minutes. Notice how stable (or variable) your classroom environment is.
What Students Should Observe:
- Temperature typically ranging from 20-25°C in a comfortable classroom
- Humidity usually between 30-60% in indoor environments
- Slight variations in readings even without environmental changes (sensor resolution)
- Values updating every 2-3 seconds automatically
- Both temperature and humidity displayed simultaneously
Challenge
Your Mission: The Atmospheric Detective
Become an atmospheric scientist! Conduct experiments to understand how temperature and humidity respond to different conditions.
Experiment 1: The Breath Test
- Record the current temperature and humidity (baseline values)
- Breathe warm, moist air directly onto the DHT11 sensor for 3-4 seconds
- Watch both temperature and humidity readings change on the dashboard
- Record the peak values - how much did each increase?
- Wait 30 seconds and observe as values return to baseline
Experiment 2: The Hand Warmth Test
- Cup your hands around the DHT11 without touching it
- Hold this position for 20-30 seconds
- Observe temperature rising from your body heat
- Does humidity also increase? Why or why not?
Discussion Questions:
- Why does breathing increase humidity? (Human breath contains water vapor from our lungs)
- Why does humidity affect comfort? (High humidity prevents sweat evaporation, making us feel hotter)
- What happens on a rainy day? (Predict: higher humidity, possibly cooler temperature)
- Why measure both values? (Temperature alone doesn't tell the full comfort story)
Bonus Challenge: Using your observations, design an "ideal comfort zone" for your classroom. What temperature and humidity range feels most comfortable? (Hint: Most people prefer 20-22°C and 40-50% humidity!)
Science Connection
Your breath contains about 90% humidity because your lungs add moisture to the air you breathe. This is why you can "see your breath" on cold days - the water vapor condenses into tiny droplets when it hits cold air!
Key Takeaways
✓ Temperature Measurement
The DHT11 uses a thermistor (temperature-sensitive resistor) to measure ambient temperature in degrees Celsius. Temperature sensing is crucial for climate control, weather prediction and protecting electronics from overheating. Understanding temperature measurement helps us create smart thermostats and environmental monitoring systems.
✓ Humidity Concept
Humidity measures the amount of water vapor in air, expressed as relative humidity (RH%). It affects human comfort, plant growth and material preservation. High humidity makes heat feel worse by preventing sweat evaporation. Measuring humidity is essential for smart homes, greenhouses and weather stations.
✓ Digital Sensors
Unlike analog sensors that output varying voltages, the DHT11 uses a digital communication protocol to send precise data. A microchip inside the sensor converts analog measurements into digital signals, reducing noise and improving accuracy. This represents more sophisticated sensor technology compared to simple resistive sensors.
✓ Environmental Monitoring
IoT enables continuous tracking of environmental conditions over time. By logging temperature and humidity data, we can identify patterns, predict problems and automate responses. This concept forms the foundation for smart buildings, precision agriculture and climate-controlled systems used in homes, museums and data centers.
Coming Up Next Week:
Week 11: Precision Temperature (DS18B20)