
Learning Objective
Successfully power up the MakerBuddy, connect it to WiFi and navigate the Dashboard interface.
Powering Up & Connectivity
Step 1: Powering Up
It's time to wake up your MakerBuddy! Follow these steps carefully.
Connect USB Cable
Plug the USB cable into the MakerBuddy and the other end into your computer or a USB power adapter.
Check the Screen
The LCD Display should light up. If it doesn't, check your cable connection.
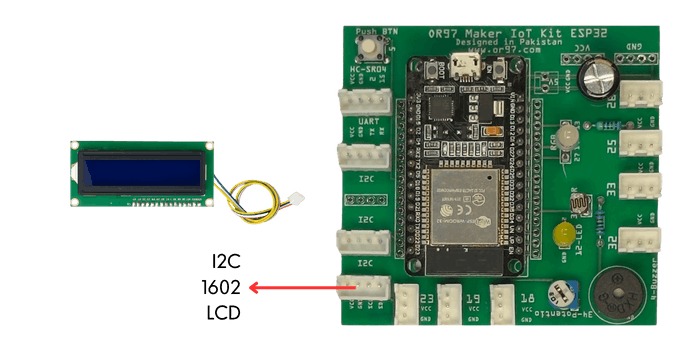
LCD 1602 Connector
Step 2: Connecting to WiFi
Access Point (AP) Mode
When MakerBuddy is new (or reset), it doesn't know your WiFi password yet. So, it creates its own network.
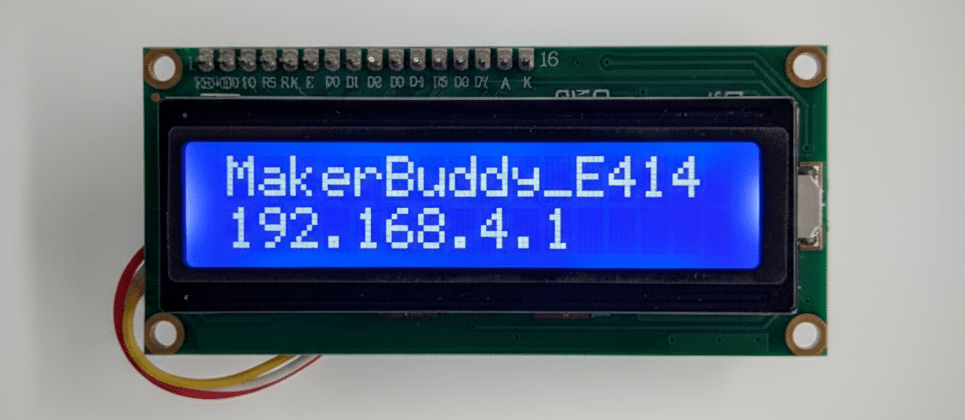
- Find the Network: On your laptop or phone, open WiFi settings. Look for a network named
MakerBuddy-XXXX(where XXXX is a last four alphnumeric of ESP32 MAC Address). - Connect: Click to connect. Default Passsword of Hotspot is
12345678. - Auto-Launch: A "Captive Portal" might pop up automatically. If not, open a browser and type:
192.168.4.1
WiFi Configuration
Now you are talking directly to the MakerBuddy. Tell it which WiFi network to join.
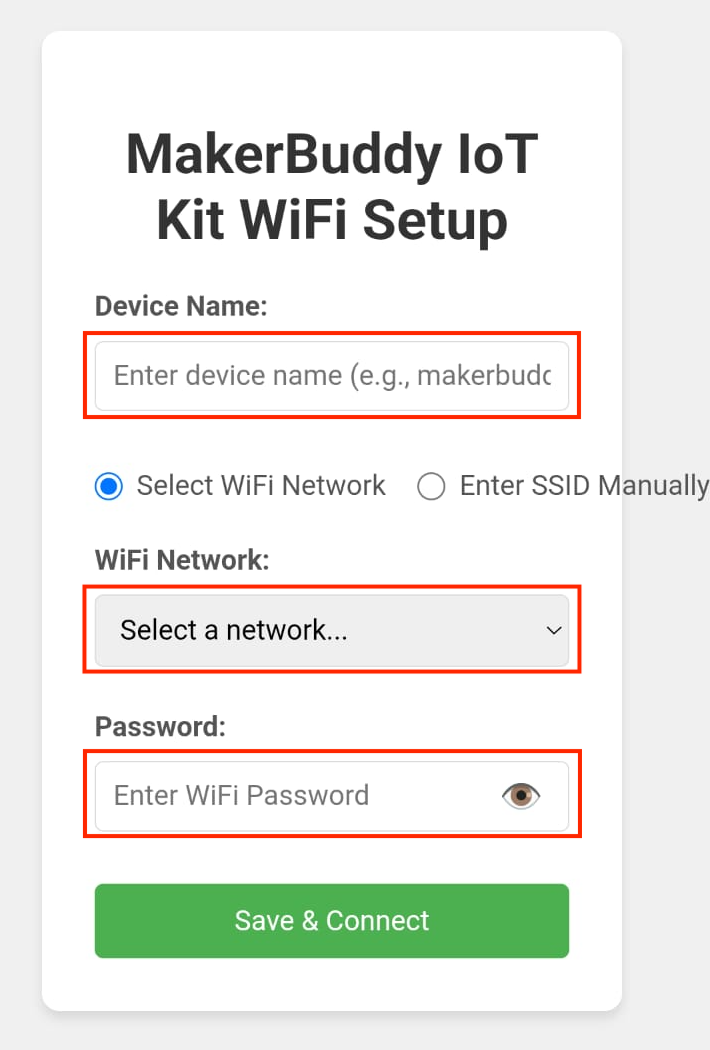
- Enter a **Device Name** (e.g., makerbuddy) to identify your kit.
- Select **Your Local WiFi** from the list.
- Enter your **WiFi Password** carefully.
- Click **Save/Connect**.
Step 3: Verification
MakerBuddy will restart and try to connect to the internet.
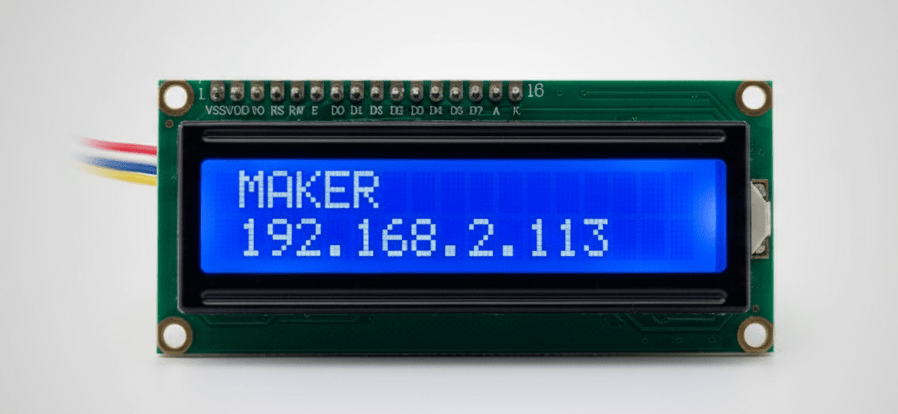
Look at the LCD Screen:
- It should say
WiFi: Connected - It will show an **IP Address** like
192.168.1.105. **Write this down!** - Note: You can access your device via this IP address or by the Device Name you saved earlier. Using names is much easier for everyone to remember and access!
Confirm it in the dashboard: Open Settings & OTA. The Device Info and Connection cards show the same device name, IP address, firmware version and local-network connection.
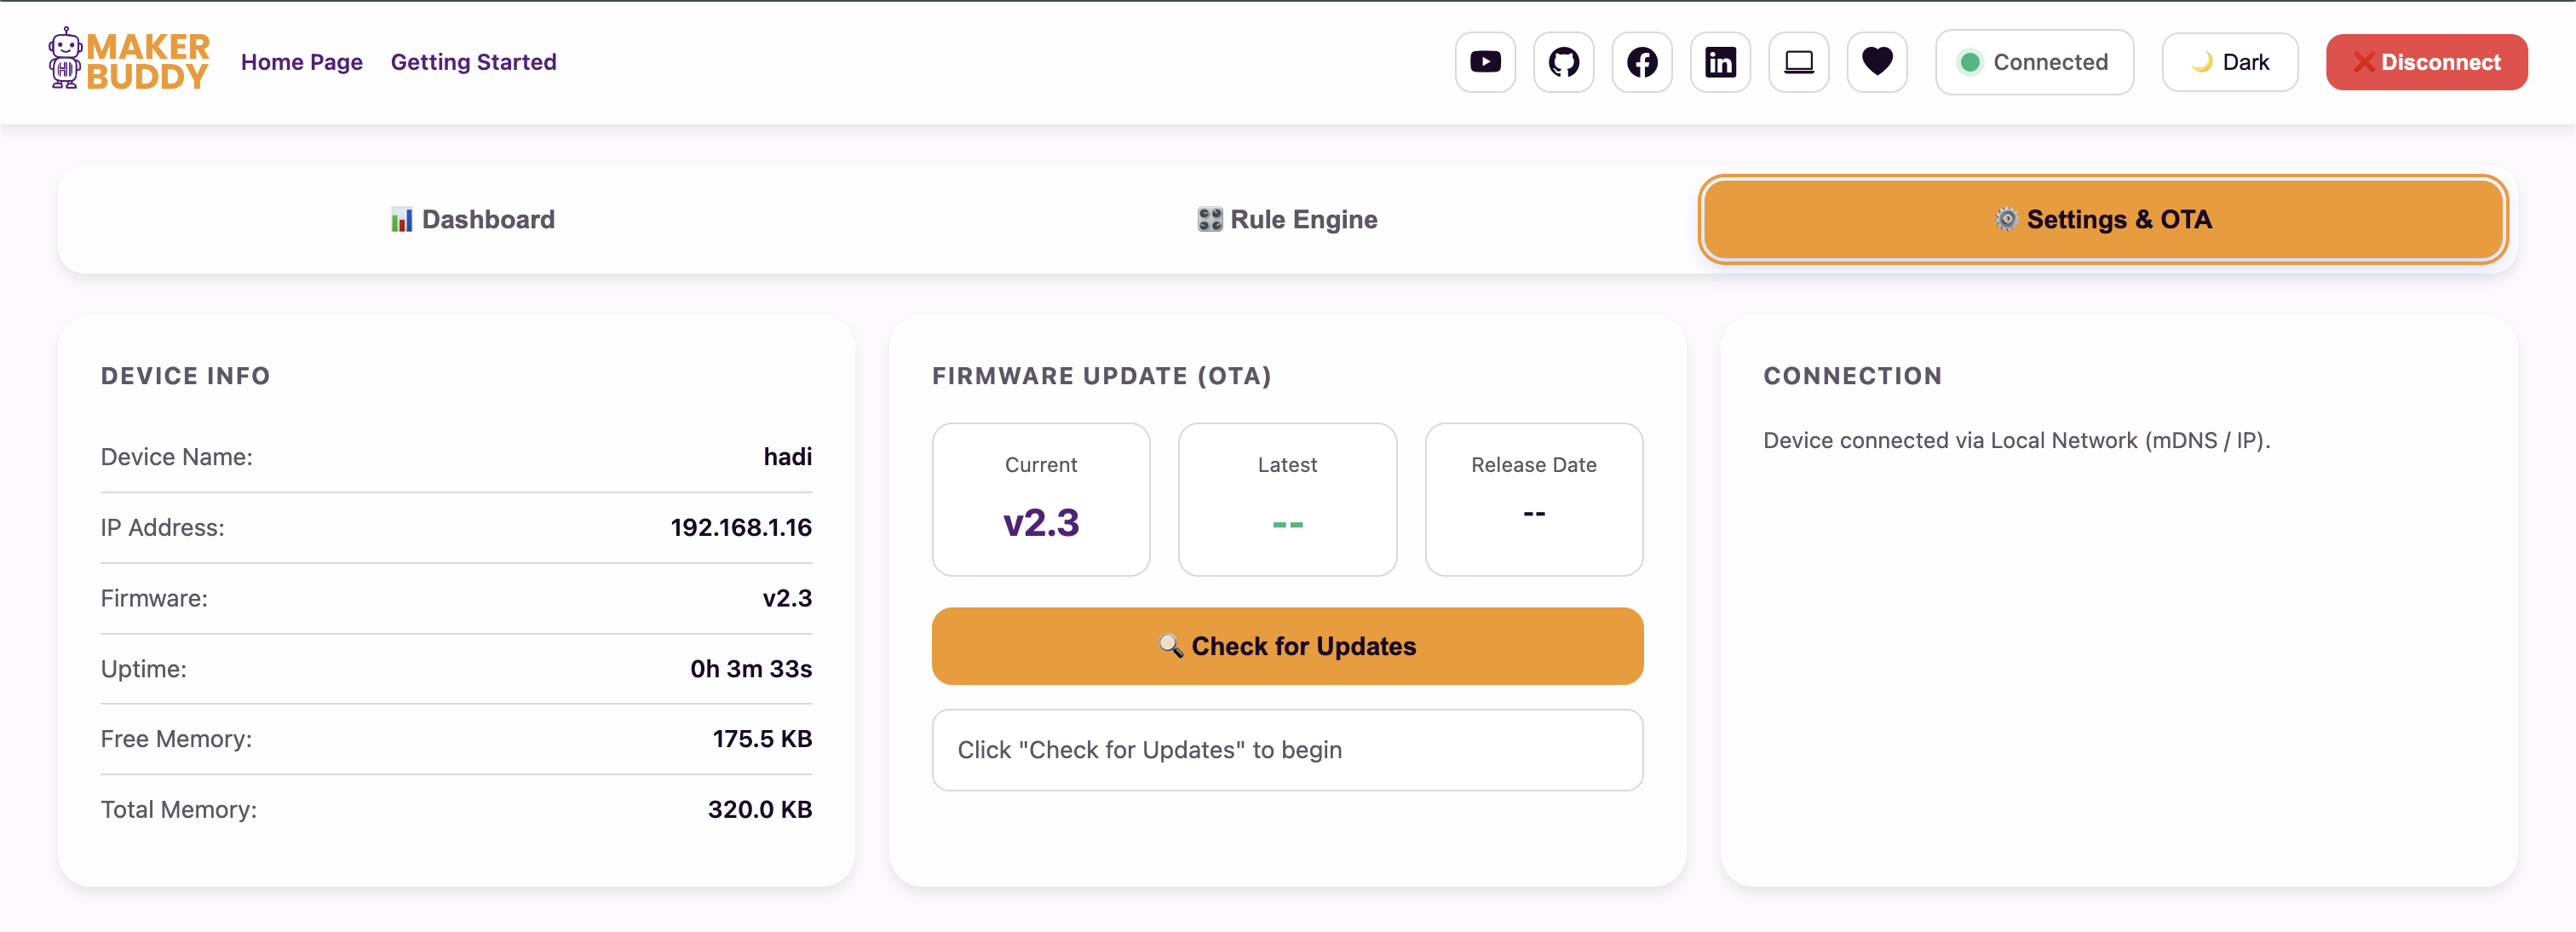
The Settings & OTA page confirms the connected device and its current firmware.
Step 4: The Interface
Now, let's go to the Makerbuddy Web App by clicking here.
The Bridge Between Hardware and Humans
The MakerBuddy dashboard is a web-based user interface that allows you to interact with physical hardware through your browser. This represents a fundamental concept in IoT: the separation between the "thing" (the hardware) and the "interface" (how we control it). Unlike a traditional light switch that must be physically touched, IoT devices can be controlled from anywhere through software interfaces.
How Web Browsers Talk to Hardware
When you click a button on the dashboard, your browser sends an HTTP request (a standardized message) to MakerBuddy's IP address. The ESP32 microcontroller receives this request, processes it and takes action (like turning on an LED). Then it sends back an HTTP response confirming the action. This happens in milliseconds! HTTP (HyperText Transfer Protocol) is the same technology that loads websites - it's been adapted to control physical devices. This is why IoT is sometimes called "the Internet of Things" - we're literally using internet protocols to control things.
User Interface (UI) vs User Experience (UX)
User Interface (UI) refers to the visual elements you see and interact with - buttons, sliders, colors, text. User Experience (UX) is broader: it's how easy, intuitive and pleasant the entire interaction feels. Good UX design means you can understand what to do without reading a manual. The MakerBuddy dashboard uses card-based design, where each component (sensor or actuator) has its own clearly labeled card with relevant controls or data displays.
Sensors vs Actuators in the Interface
The dashboard makes a clear visual distinction between sensor cards (which display data you can read but not change) and actuator cards (which have controls like buttons, sliders or toggles). Sensor cards show real-time information updating automatically - temperature readings, button states, light levels. Actuator cards let you take action - turn things on/off, change brightness, move motors. This mirrors the Input-Process-Output cycle: sensors provide input, actuators create output.
For Teachers
This lesson bridges physical computing with web technologies, making it highly interdisciplinary. Students learning HTML/CSS can appreciate how those skills apply to hardware control. Demonstrate the HTTP request-response cycle using browser developer tools (F12) if students are ready for it. Emphasize the design principle that "form follows function" - sensor cards look different from actuator cards because they do different things. Consider having students critique the dashboard's UX: what's clear? What could be improved? This develops critical thinking about interface design they encounter daily in apps and websites.
For Parents
This week introduces your child to user interface design - how software is organized to be intuitive and easy to use. Every app on your phone, every website you visit and every smart home device you control was carefully designed with UX principles in mind. Your child is learning to think like a designer: how do we make technology accessible and understandable? They're also learning that websites can do more than display information - they can control physical devices using the same HTTP technology that powers the internet. This connects software skills to the physical world.
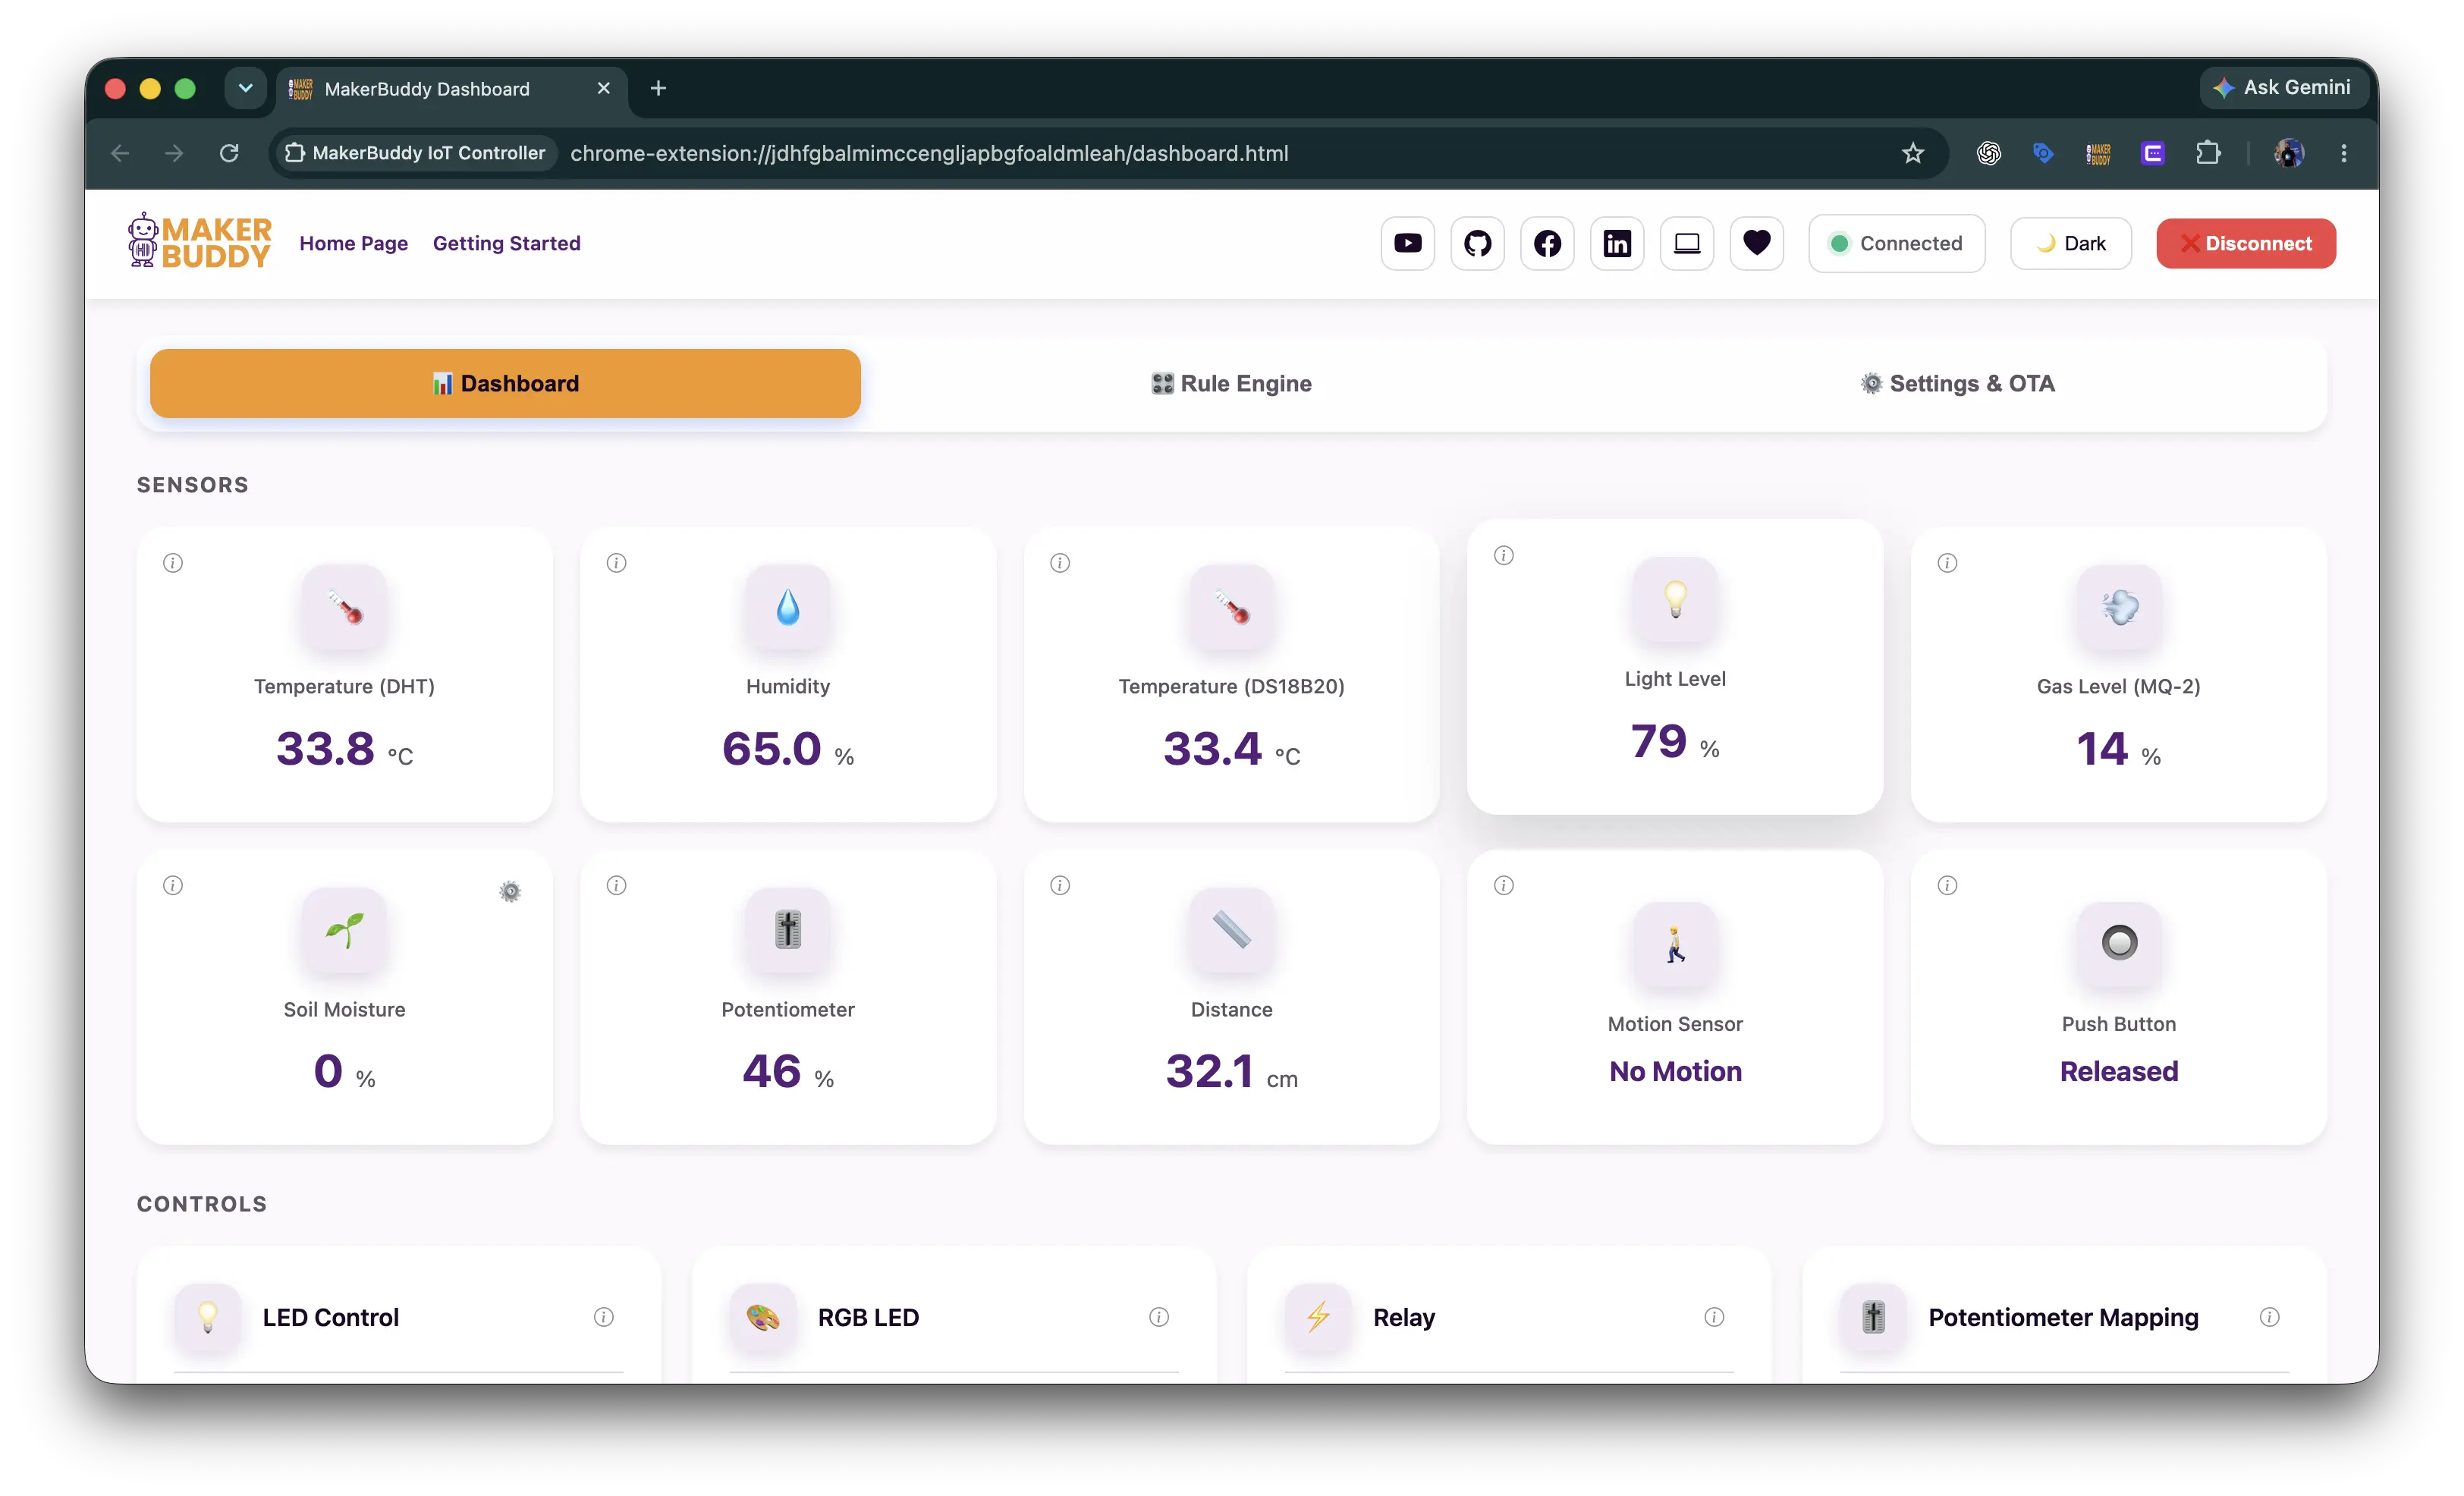
Figure 1: Sensor cards displaying real-time data from connected sensors
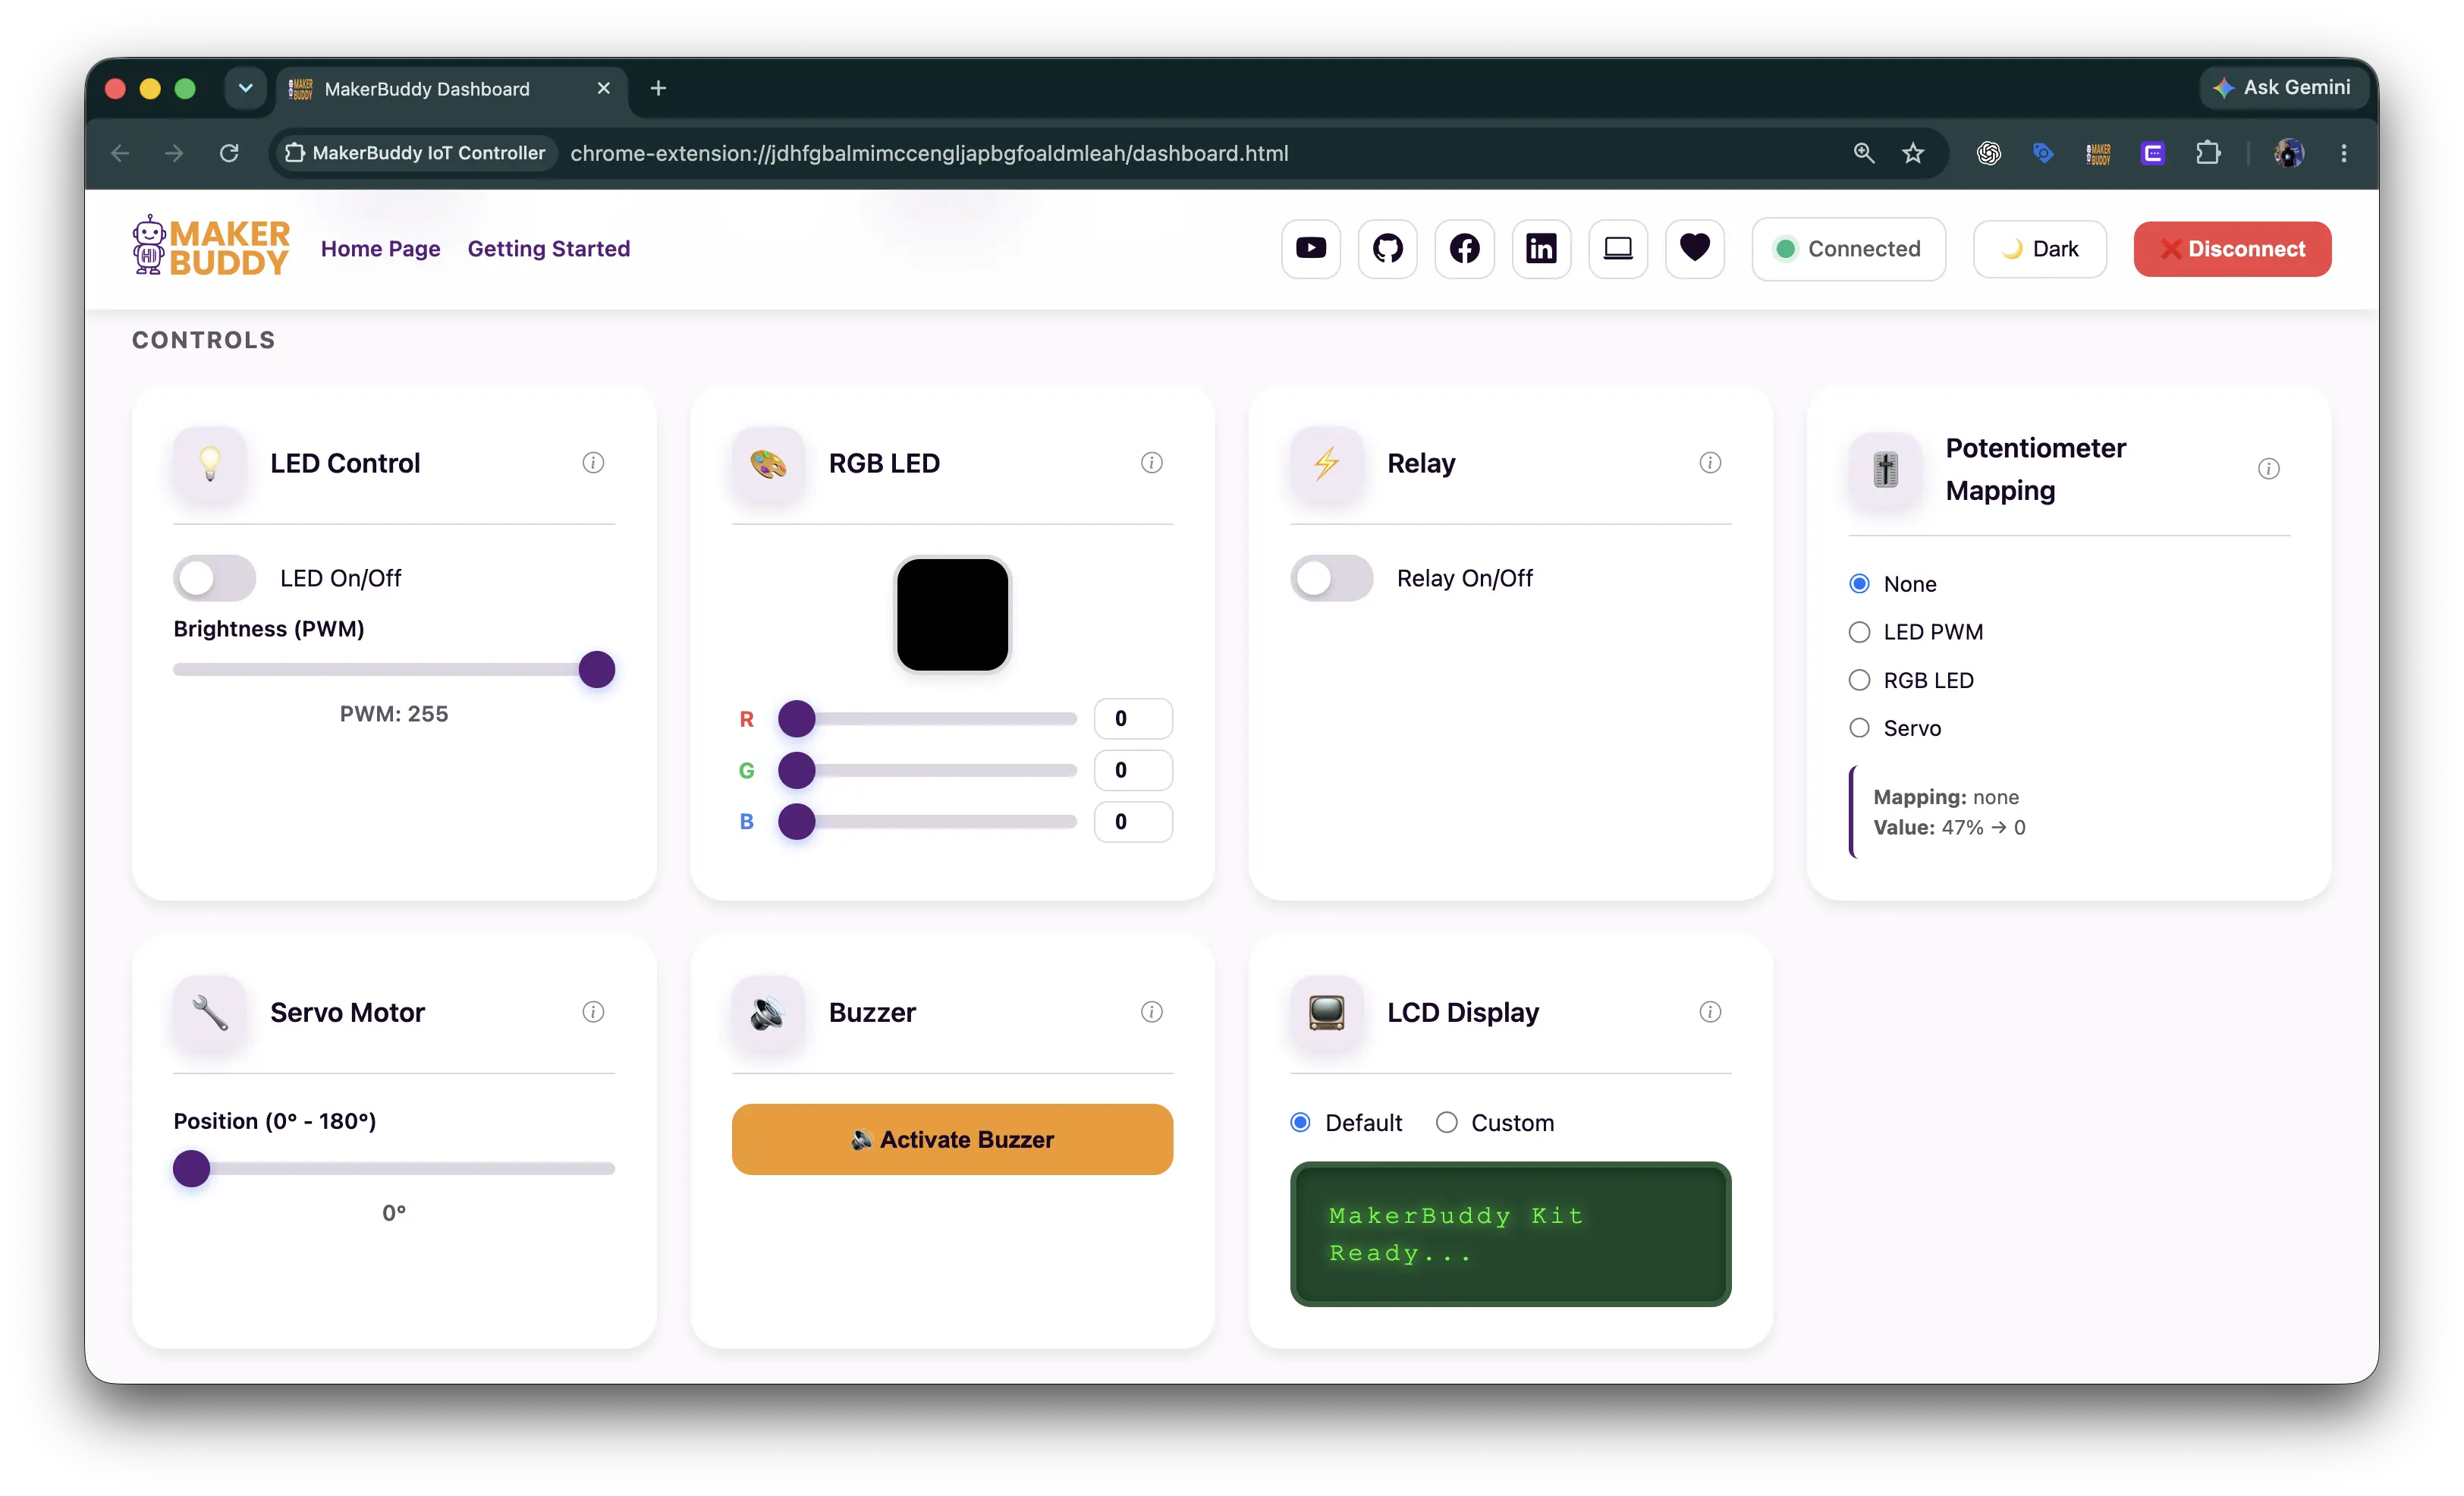
Figure 2: Actuator cards with interactive controls for outputs
Personalizing the Dashboard
The Settings & OTA tab also lets you choose which sensor and actuator cards are visible. Each row has an Enabled checkbox plus background and accent colour controls. Keep every card enabled while learning the kit; later, hide unused cards to make a project dashboard easier to read.
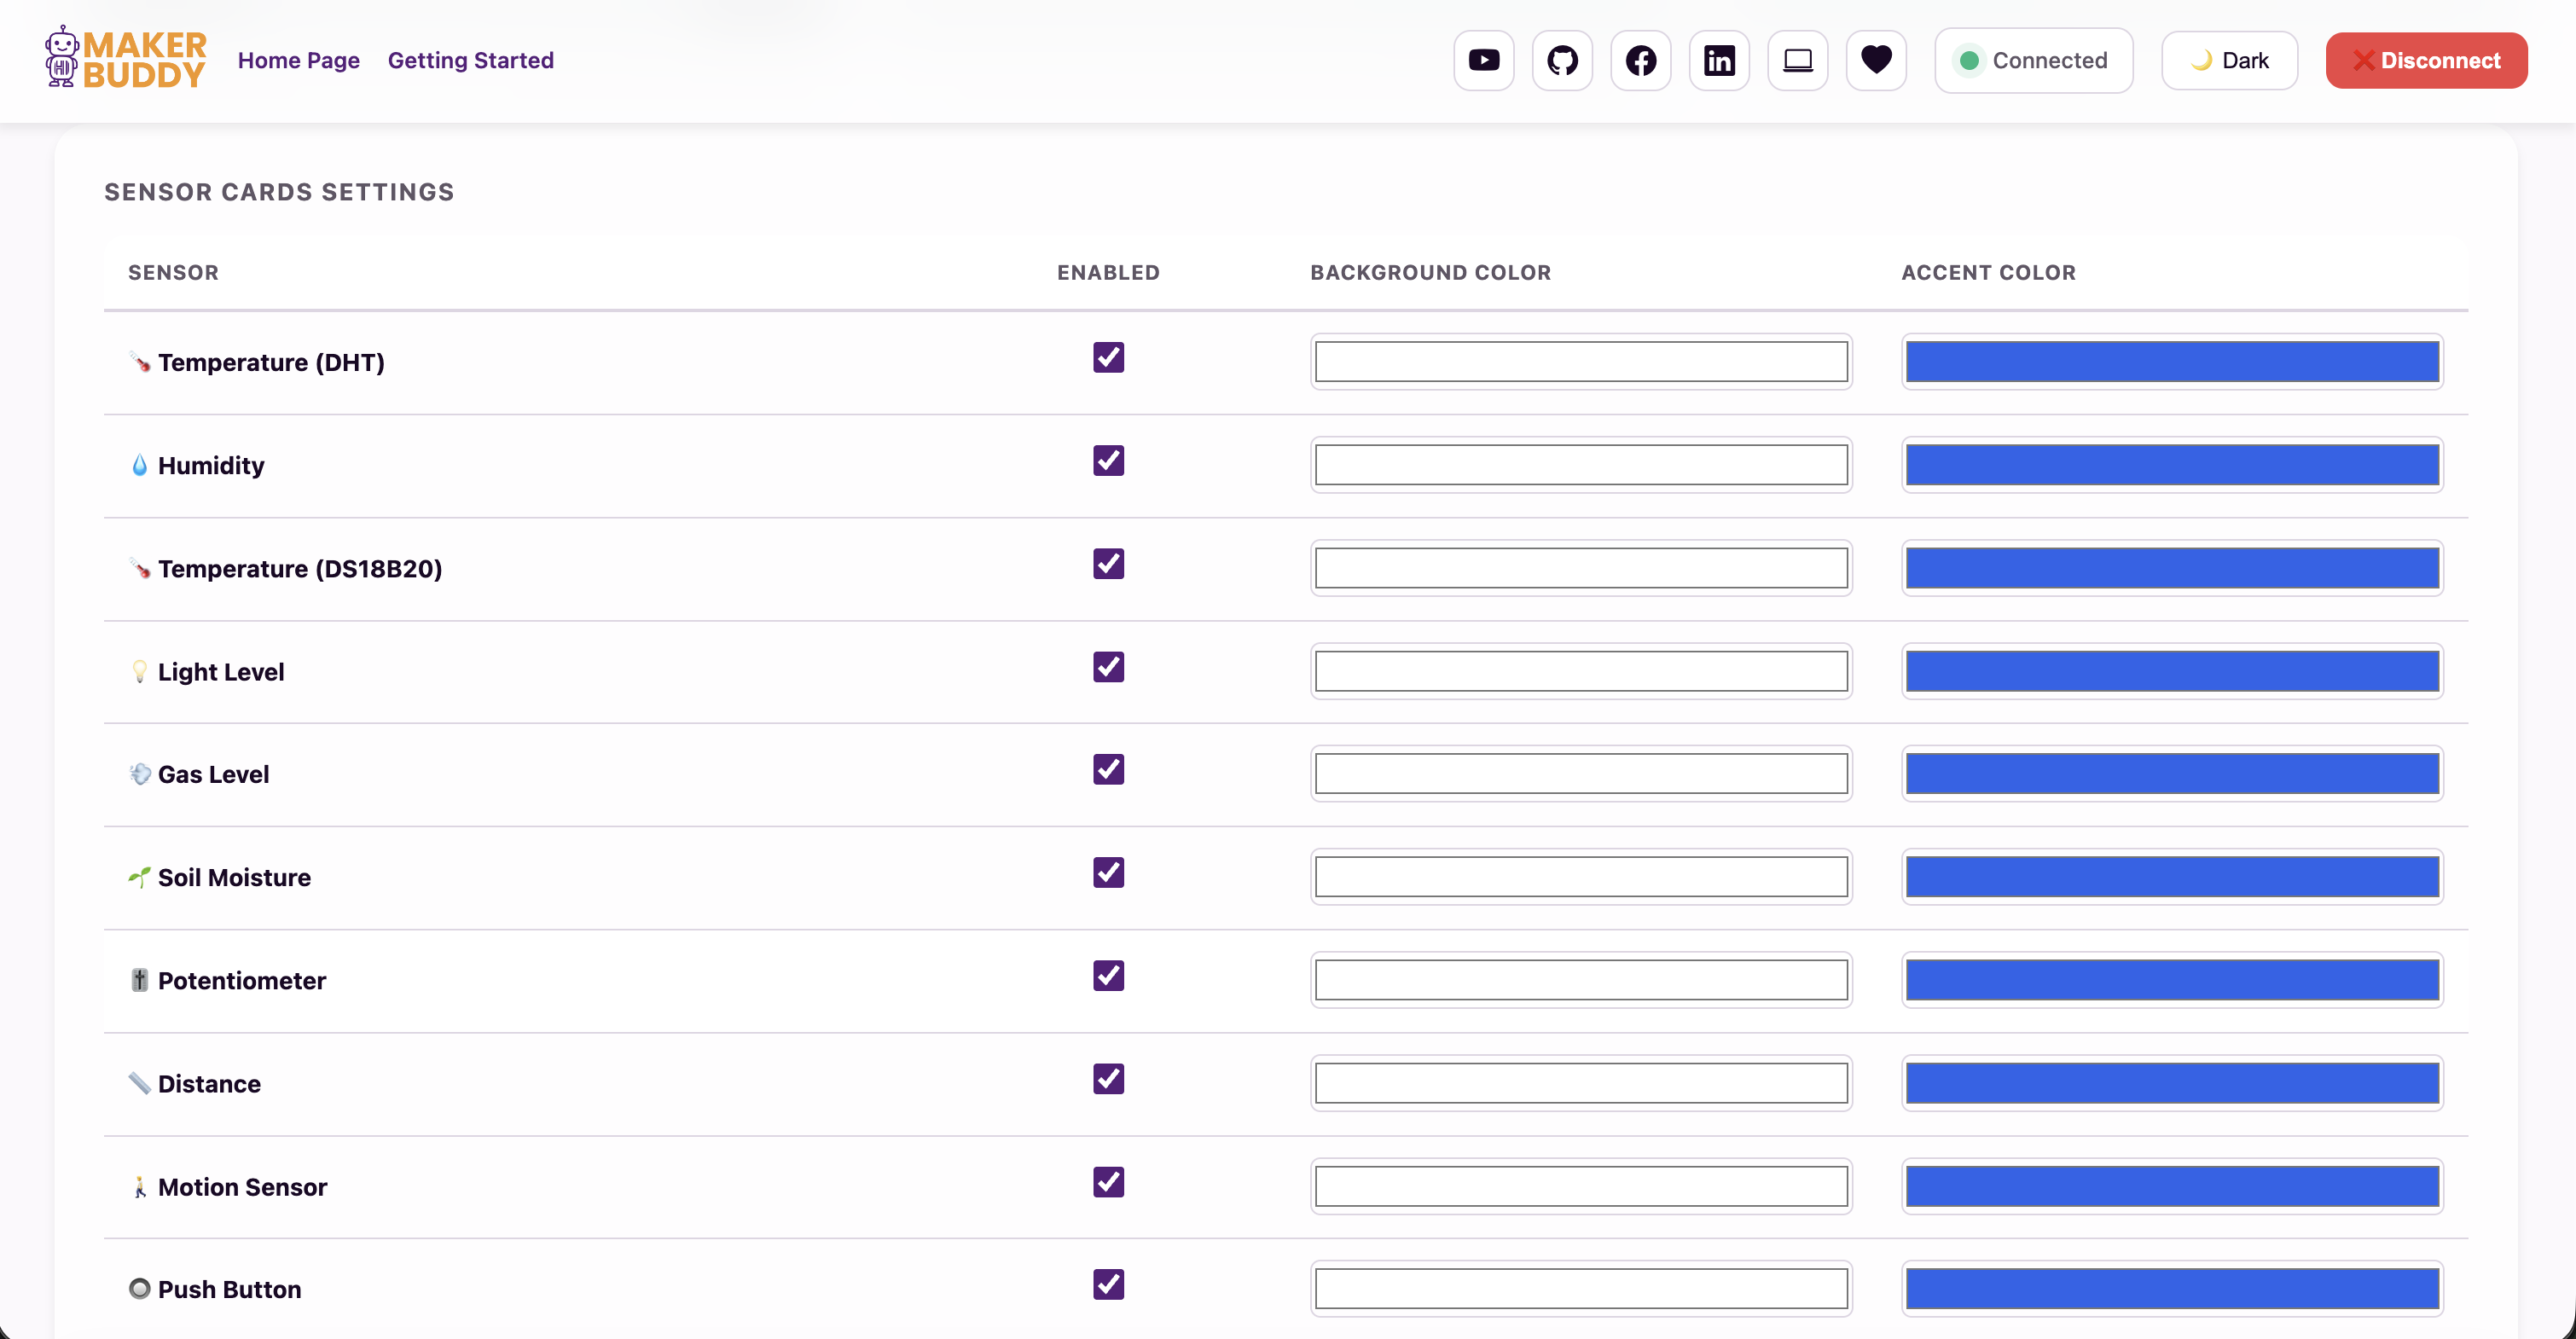
Sensor card settings
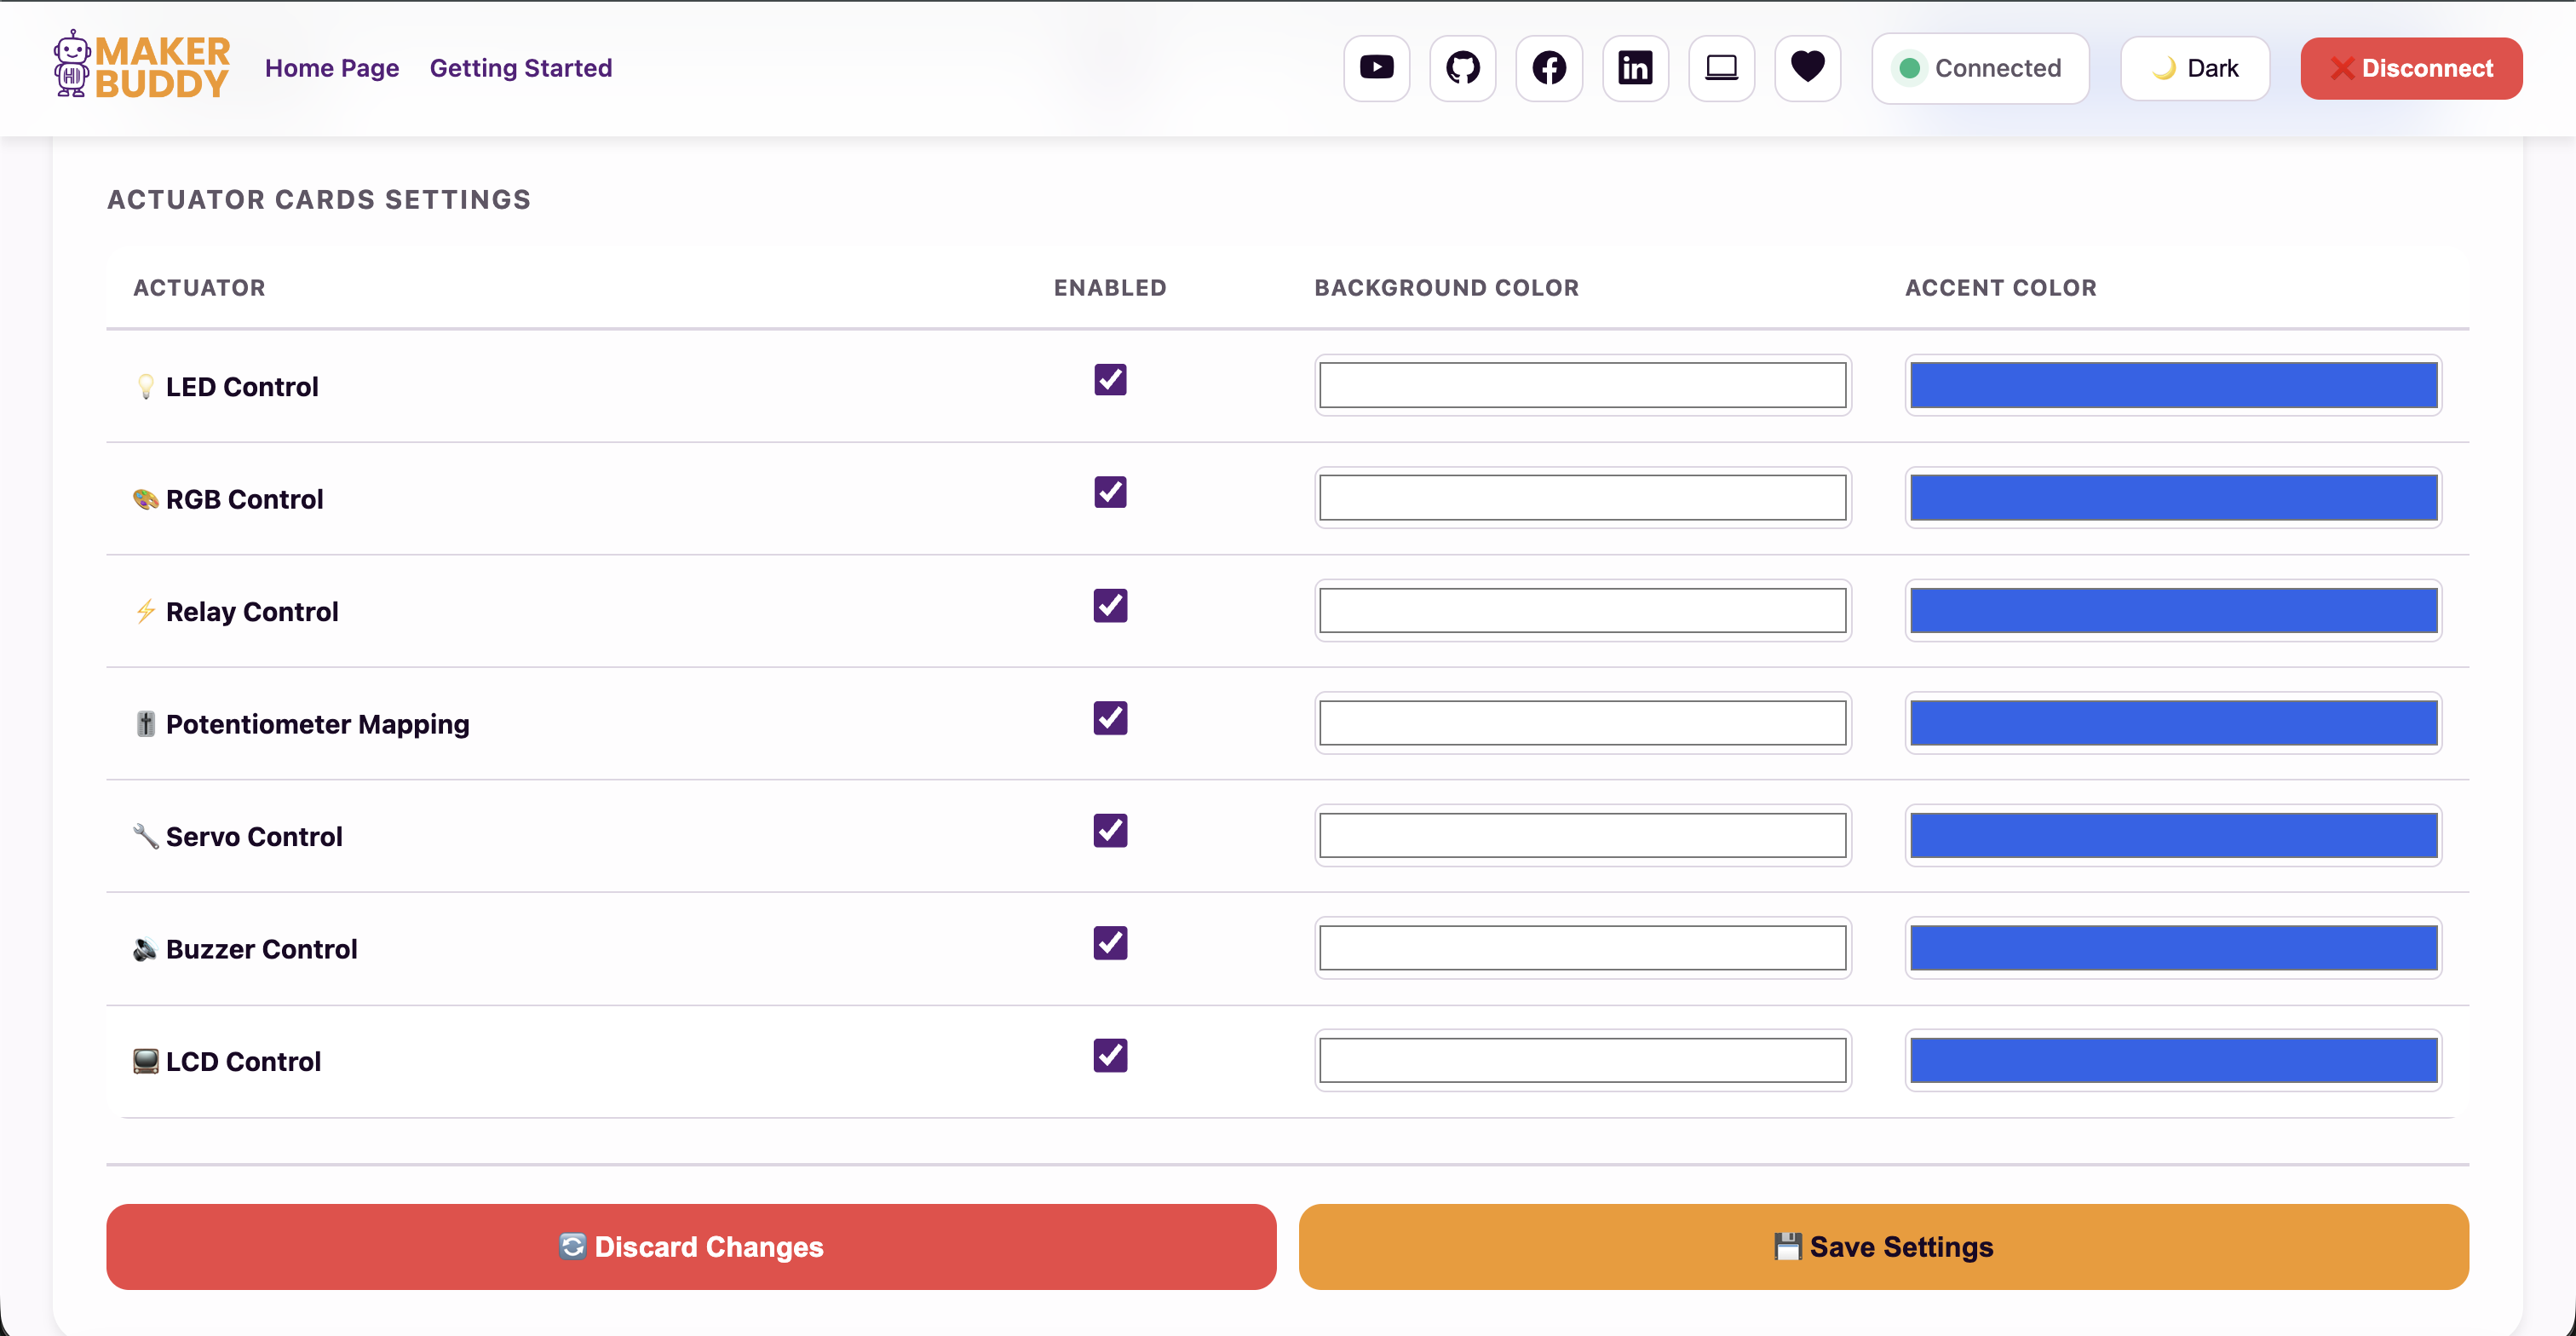
Actuator card settings
Hands-On Activity: Dashboard Exploration
Activity Duration: 20-25 minutes
Now that you are connected, let's explore the tool you will use for the rest of the year.
Step-by-Step Instructions:
- Access the Dashboard: Open your browser and navigate to app.makerbuddy.cc. Enter your MakerBuddy's new IP address or the Device Name you configured.
- Check Connection Status: Look at the top of the dashboard for a status indicator. It should show "Connected" in green.
- Identify Sensor Cards: Scroll through the dashboard and locate all sensor cards. These will display data but won't have interactive controls. List them:
- Button State (shows whether button is pressed or not)
- Gas Level (MQ-2 sensor reading)
- Soil Moisture (in Percentage)
- Potentiometer Value (displays the knob position)
- Light Level (LDR reading)
- Temperature & Humidity (DHT11 data when connected)
- DS18B20 Temperature (when probe is connected)
- Distance (HC-SR04 ultrasonic sensor data)
- Motion Detection (PIR sensor status)
- Identify Actuator Cards: Find all cards with interactive controls (buttons, sliders, toggles):
- LED Control (on/off toggle and brightness slider)
- RGB LED (color picker or RGB sliders)
- Buzzer (trigger button)
- Servo Motor (angle slider)
- Relay (on/off switch)
- LCD Display (text input field)
- Potentiometer Mapping (LED PWM/RGB/SG90 Servo)
Challenge
Your Mission: Network & Dashboard Master
Complete the full setup loop and map your dashboard!
- Step 1: Successfully connect MakerBuddy to your WiFi and write down its IP address.
- Step 2: Load the dashboard on your computer.
- Step 3: Find the "Uptime" or "Status" indicator. How long has your MakerBuddy been running?
- Step 4: Find 3 Sensors and 3 Actuators on the screen.
Bonus Challenge: Unplug your MakerBuddy and plug it back in. Watch the LCD. Does it connect faster this time? Why? (Hint: It remembers the password!)
Key Takeaways
✓ UI/UX Design
User Interface (UI) is what you see and interact with, while User Experience (UX) is how intuitive and pleasant the interaction feels. Good design makes technology accessible by organizing information logically and making controls self-explanatory.
✓ HTTP Requests
Web browsers communicate with IoT devices using HTTP requests and responses, the same protocol that powers websites. When you click a button, an HTTP message is sent to the device, which processes it and sends back a confirmation.
✓ Sensor vs Actuator Cards
Sensor cards display real-time data from inputs (read-only information that updates automatically). Actuator cards provide interactive controls for outputs (buttons, sliders, toggles that send commands to hardware). This visual distinction mirrors the Input-Output model.
✓ Dashboard Navigation
Card-based design organizes complex systems into manageable, clearly labeled sections. Each component gets its own card, making it easy to find specific sensors or controls. This design pattern is common in modern applications and IoT platforms.
Coming Up Next Week:
Week 4: Hello World (The LED)